Inventory Report
This report provides a detailed overview of a company’s stock levels. It tracks the quantity, location, and value of products in inventory, helping businesses manage their stock effectively.
Manage Columns:
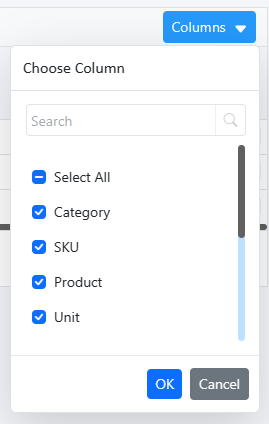
Select the columns to be visible
Filter & search :
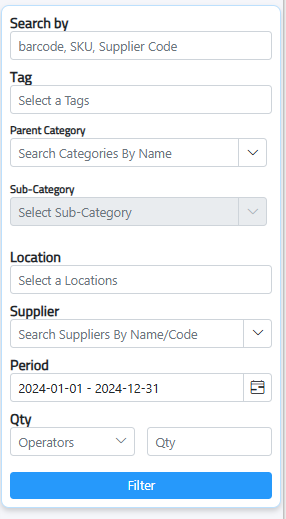
1. Search by: search by Barcode, SKU, supplier code
2. Tag: Select tags to filter data based on specific labels or classifications.
3. Parent Category: Choose the main category.
4. Sub-Category: select from the drop-down list the sub-category within the chosen parent category.
5. Location: Filter the report based on specific locations
6. Supplier: Select the supplier to filter data related to specific vendors.
7. Period: Set the date range for the report to include data within that time
8. Qty: Apply quantity filters to focus on specific amounts or ranges of items.

Click filter and export the inventory report in 2 formats.

print pdf or export excel.
Determination Of Product Aging
This report provides insights into how long products have been in stock, highlighting slow-moving or outdated inventory.
Manage Columns:
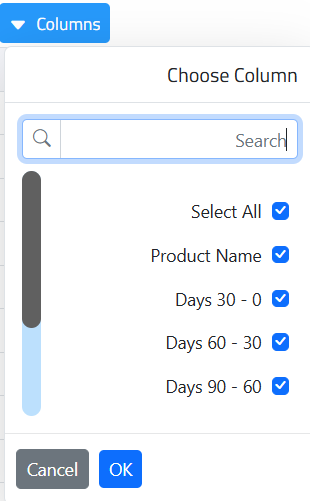
Select the columns to be visible
Filter & Search :

Group By:
- By products: Organize report by individual products.
- Locations: Organize by storage locations.
- Product and locations: Organize by both product and location.
Calculate based:
- Qty: Calculates based on quantity.
- Cost: Calculates based on cost.
- Qty and cost: Calculates based on both quantity and cost.
Cost: Filter by product cost.
Search by: Search products based on various criteria.
Tag: Filter by product tags.
Parent Category: Filter by main product category.
Sub-Category: Filter by subcategories of products.
Location: Filter based on storage location.
Period: Specify a time period for the report.
Qty: Filter by product quantity.
Date: Filter by transaction date.

Click filter and export the inventory report in 2 formats.

print pdf or export excel.
Report Of Stagnant Products
This report provides details on products that have been inactive or slow-moving in stock. It includes the first purchase date, last sale date, and the number of movements for each product, helping businesses identify items that may need attention, clearance, or promotional efforts.
Manage Columns:
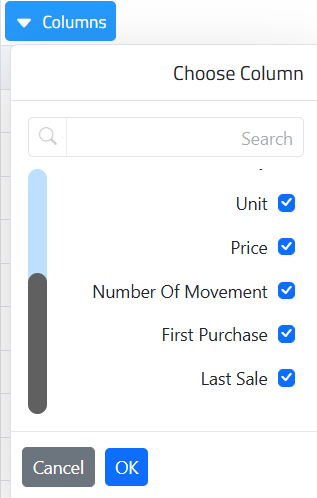
Select the columns to be visible
Filter & Search :
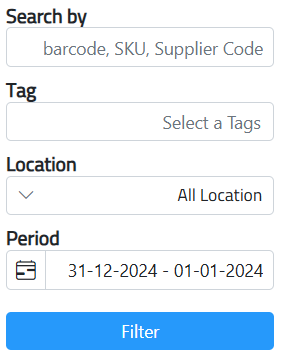
- Search by : Supplier code, Product barcode or SKU
- Tag: Filter using product tags.
- Location: Filter by specific storage location.
- All Locations: Show products across all locations.
- Period: Filter by a specific time period.

Click filter and export the inventory report in 2 formats.

print pdf or export excel.
Most Active Product Report
This report highlights the products with the highest movement in stock, It provides insights into which items are in high demand, helping businesses manage inventory more effectively and ensure optimal stock levels.
Manage Columns:
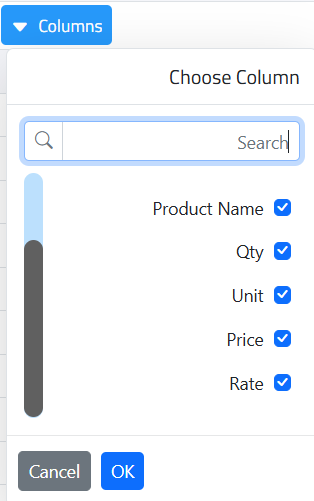
Select the columns to be visible
Filter & Search :

- Search by : Supplier code, Product barcode or SKU
- Tag: Filter using product tags.
- Location: Filter by specific storage location.
- All Locations: Show products across all locations.
- Period: Filter by a specific time period.

Click filter and export the inventory report in 2 formats.

print pdf or export excel.
Negative Product Report
This report lists products with defects that don’t meet quality standards. It helps companies find and fix these issues and improve product quality.
Manage Columns:
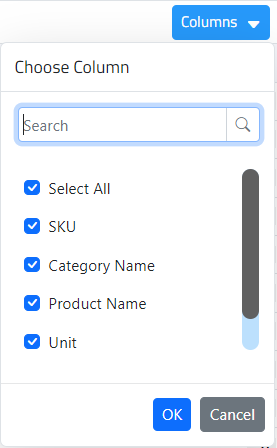
Select the columns to be visible
Filter & Search :
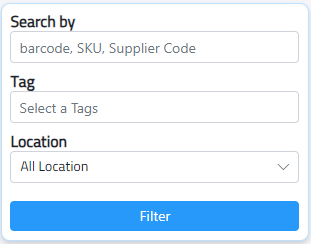
- Search by : Supplier code, Product barcode or SKU
- Tag: Filter using product tags.
- Location: Filter by specific storage location or all location

Click filter and export the inventory report in 2 formats.

print pdf or export excel.
Product History
This page streamlines the process of viewing the detailed product movement summary.
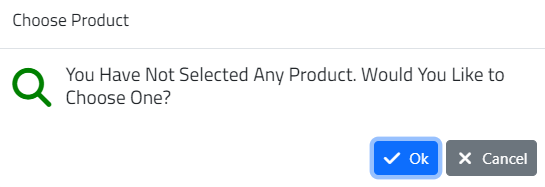
When you first open the Product History page, a message will appear. Simply click “OK” to proceed and view the product history details.

Displays the reference/ type of document associated with the product, quantity, stock quantity, cost, price ad location with the type of each documents.
Change Product: To view the history of another product, click the change product button and select the product.

QTY, AVG Cost, & Latest Cost: Displays the quantity, average cost, and latest cost per location.
Transaction Filtering: Use the “Show Draft Entries” button to highlight draft transactions.
Stock Balance Report
This report provides an overview of the quantities and values of products held in inventory at a specific time. It helps businesses track their stock levels, understand product availability, and manage inventory effectively. The report can include details like product quantities, costs, locations, and suppliers, making it essential for informed decision-making in inventory management.
Manage Columns:
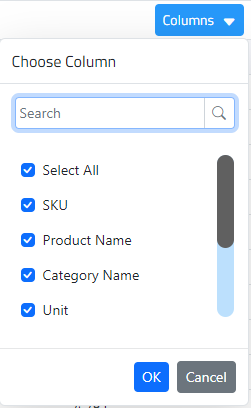
Select the columns to be visible
Filter & Search :
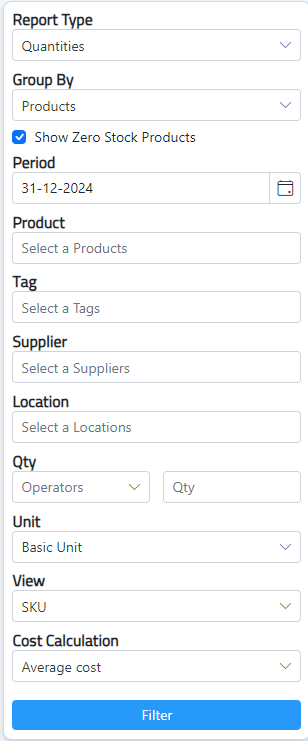
- Report Type: Quantities: Shows only stock quantities / Quantities and Cost: Displays both quantities and costs.
- Group By:
- Products: Click on Show zero stock products
- Products&Categories
- Products, Locations & Categories
- Products & Locations
- Period: Defines the time range for the report.
- Product: Filter by specific products.
- Tag: Filter by assigned tags.
- Supplier: Filter by supplier.
- Location: Filter by specific stock locations.
- Qty: Set minimum or maximum stock levels.
- Unit: Basic Unit: Shows smallest measurement / Largest Packing Unit: Shows larger units
- View: SKU: Displays Stock Keeping Unit / Barcode: Shows product barcodes.
- Cost Calculation: Latest Supply Price: Uses the most recent price / Average Cost: Uses average cost from past transactions.

Click filter and export the inventory report in 2 formats.

print pdf or export excel.
Stock Movement Report
This report provides a comprehensive overview of inventory activity over a specific period. It includes the opening balance, which is the quantity of stock at the start of the period, followed by incoming stock that details products received, including purchases and returns. The report also shows outgoing stock, reflecting products sold or transferred out.
Manage Columns:
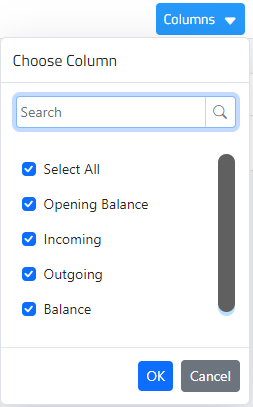
Select the columns to be visible
Filter & Search :
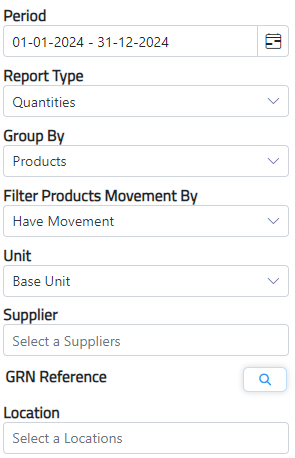
- Period: Select Date Range
- Report Type: Quantity, Quantities&Costs , Cost
- Group By:
- Products
- Products&Categories
- Products, Locations & Categories
- Products & Locations
- Categories
- Locations
- Parent Locations
- Filter Products Movement By:
- Have Movement: Only includes products that have had transactions during the selected period.
- Not Sold & No opening balance
- Not Sold & Have opening balance
- Opening balance & No Movement
- No opening balance & Have movement
- Opening balance & Have movement
- Supplier: Filter results based on specific suppliers.
- GRN Reference: Click on search button to select by GRN references to track specific shipments.


- Location: Allows selection of specific stock locations to focus the report.
Product Filter:
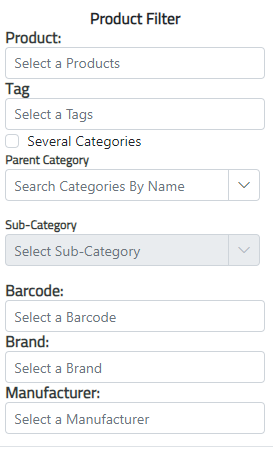
- Product: Specify the product.
- Tag: Filter by tags assigned to products for easier categorization.
- Parent Category: Select a main category of products, OR Click on Several Categories button to select more than one category.

- Sub-Category: Further narrow down to specific sub-categories.
- Barcode: Filter products using their barcode.
- Brand: Filter by product brand.
- Manufacturer: Filter by the product’s manufacturer.
- Cost Calculation: Latest Supply Price: Uses the most recent price / Average Cost: Uses average cost from past transactions.
- View Report: A button to generate and display the report based on the selected filters, Either Total or Details

Click filter and export the inventory report in 2 formats.

print pdf or export excel.
Turnover Ratio Report
This report measures how efficiently a business utilizes its assets to generate revenue over a specific period, which indicate how quickly a company sells its inventory and collects payments from customers.
Manage Columns:
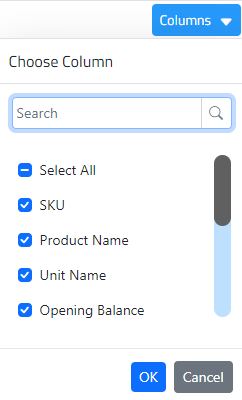
Select the columns to be visible
Filter & Search :
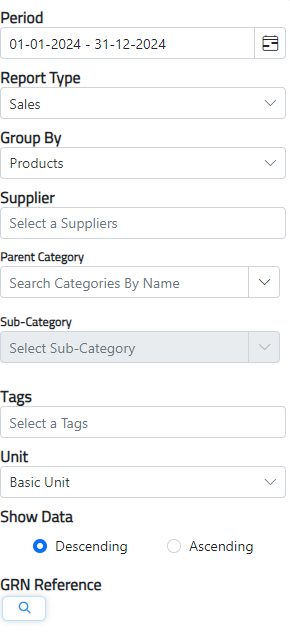
- Period: Set the reporting period
- Report Type: Sales: Focuses on sales data / Product & Stock: Includes both product and stock information.
- Group By:
- Products
- Products&Categories
- Products, Locations & Categories
- Products & Locations
- Supplier: Filter results based on specific suppliers.
- Parent Category
- Sub-Category
- Tags
- Unit: Unit: Basic Unit: Shows smallest measurement / Largest Packing Unit: Shows larger units.
- Show Data: Descending or Ascending
- GRN Reference: Click on search button to select by GRN references to track specific transactions.

Click filter and export the inventory report in 2 formats.

print pdf or export excel.
GRNs and PO Quantity Matching
The GRNs and PO Quantity Matching report generates a detailed comparison between the quantities listed on Goods Received Notes (GRNs) and those specified in Purchase Orders (POs). It will show the ordered Qty, Received Qty & Different Qty. This report helps identify discrepancies between what was ordered and what was received, ensuring that inventory records are accurate.
Manage Columns:
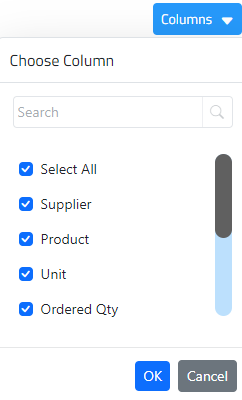
Select the columns to be visible
Filter & Search :
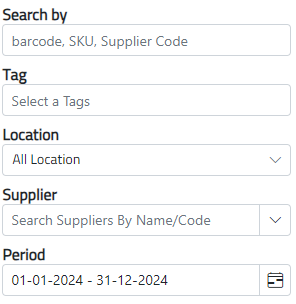
1. Search by: Search by Barcode, SKU, supplier code
2. Tag: Select tags to filter data based on specific labels or classifications.
3. Location: Filter the report based on specific locations
4. Supplier: Filter the report to show matches for products from specific suppliers.
5. Period: Set the reporting period

Click filter and export the inventory report in 2 formats.

print pdf or export excel.
