Inventory Report
This report provides a detailed overview of a company’s stock levels. It tracks the quantity, location, and value of products in inventory, helping businesses manage their stock effectively.
Manage Columns:
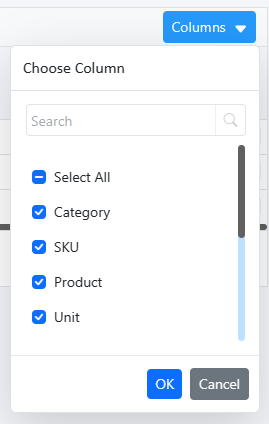
Select the columns to be visible
Filter & search :
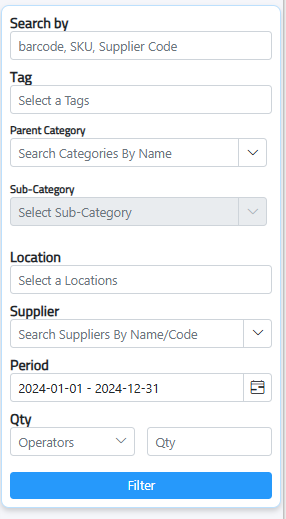
1. Search by: search by Barcode, SKU, supplier code
2. Tag: Select tags to filter data based on specific labels or classifications.
3. Parent Category: Choose the main category.
4. Sub-Category: select from the drop-down list the sub-category within the chosen parent category.
5. Location: Filter the report based on specific locations
6. Supplier: Select the supplier to filter data related to specific vendors.
7. Period: Set the date range for the report to include data within that time
8. Qty: Apply quantity filters to focus on specific amounts or ranges of items.

Click filter and export the inventory report in 2 formats.

print pdf or export excel.
Determination Of Product Aging
This report provides insights into how long products have been in stock, highlighting slow-moving or outdated inventory.
Manage Columns:
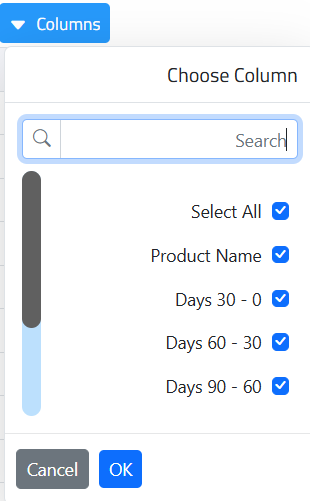
Select the columns to be visible
Filter & Search :

Group By:
- By products: Organize report by individual products.
- Locations: Organize by storage locations.
- Product and locations: Organize by both product and location.
Calculate based:
- Qty: Calculates based on quantity.
- Cost: Calculates based on cost.
- Qty and cost: Calculates based on both quantity and cost.
Cost: Filter by product cost.
Search by: Search products based on various criteria.
Tag: Filter by product tags.
Parent Category: Filter by main product category.
Sub-Category: Filter by subcategories of products.
Location: Filter based on storage location.
Period: Specify a time period for the report.
Qty: Filter by product quantity.
Date: Filter by transaction date.

Click filter and export the inventory report in 2 formats.

print pdf or export excel.
Report Of Stagnant Products
This report provides details on products that have been inactive or slow-moving in stock. It includes the first purchase date, last sale date, and the number of movements for each product, helping businesses identify items that may need attention, clearance, or promotional efforts.
Manage Columns:
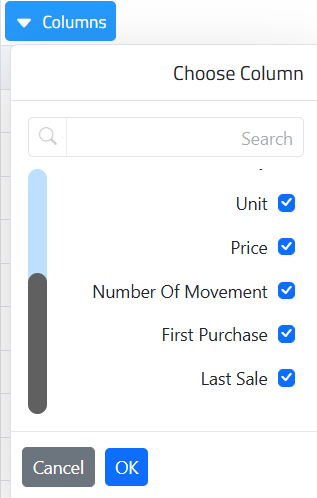
Select the columns to be visible
Filter & Search :
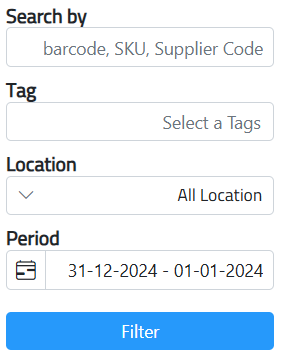
- Search by : Supplier code, Product barcode or SKU
- Tag: Filter using product tags.
- Location: Filter by specific storage location.
- All Locations: Show products across all locations.
- Period: Filter by a specific time period.

Click filter and export the inventory report in 2 formats.

print pdf or export excel.
Most Active Product Report
This report highlights the products with the highest movement in stock, It provides insights into which items are in high demand, helping businesses manage inventory more effectively and ensure optimal stock levels.
Manage Columns:
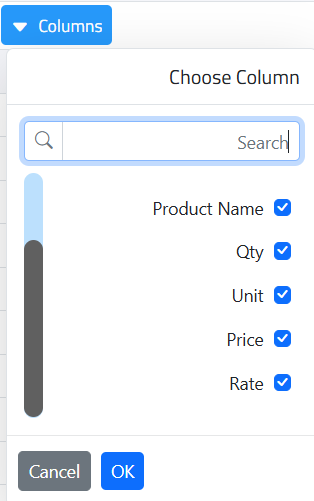
Select the columns to be visible
Filter & Search :

- Search by : Supplier code, Product barcode or SKU
- Tag: Filter using product tags.
- Location: Filter by specific storage location.
- All Locations: Show products across all locations.
- Period: Filter by a specific time period.

Click filter and export the inventory report in 2 formats.

print pdf or export excel.
Invoicing Profit Report
Movement Of Product According To Prices
This report tracks how changes in product prices affect sales and inventory movement over time. it will display comparative prices, differences between price points, and the rate at which product movement changes.
Manage Columns:
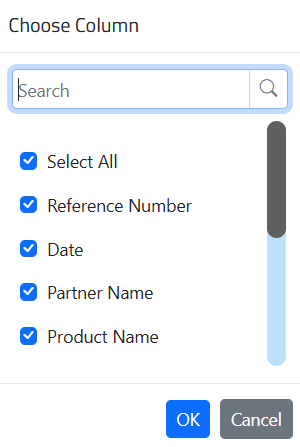
Select the columns to be visible
Filter & search :
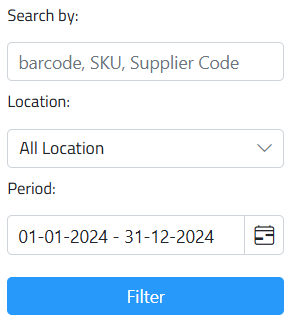
- Search by: Filter by specific products, barcode or Supplier code.
- Location: Filter by specific stock locations.
- Period: Search by date.

Click filter and export the report in Excel

Movement Of Product According To Invoices
This report will display the quantities and prices of invoices, such as purchases, sales, beginning inventory, stock entering and leaving the warehouse, and the remaining balance. This report offers a comprehensive overview of product flow, enabling businesses to track inventory levels and financial performance accurately.
Manage Columns:
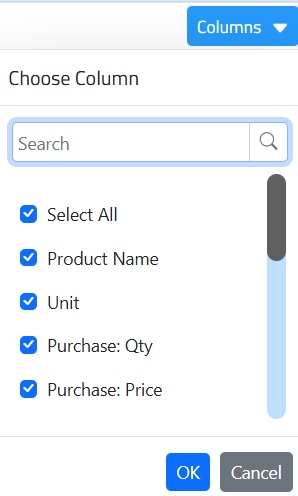
Select the columns to be visible
Filter & search :

- Search by: Filter by specific products, barcode or Supplier code.
- Location: Filter by specific stock locations.
- Period: Search by date.
Click filter and export the report in Excel

Sales Representative Report
This report shows each sales representative’s performance, including their name, country, total sales, and number of clients.
Manage Columns:
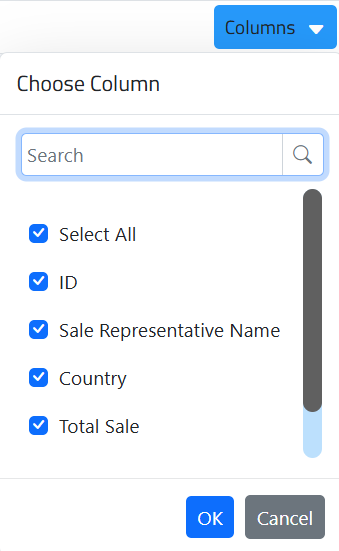
Click the expand button to view detailed client information, total amounts, and invoice status.

Sales Report
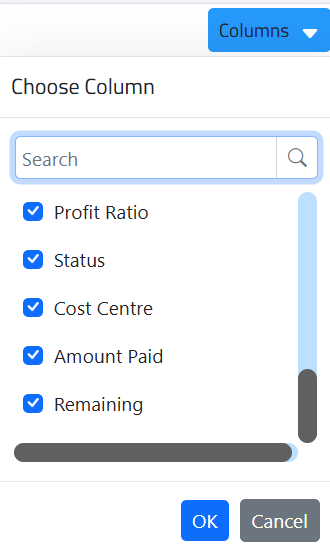
The Sales Report provides a comprehensive view of sales transactions, showing key details for each client, including all discounts applied, costs, profit, profit ratio, and transaction status. It also includes cost centers, total amount, amount paid, and any remaining balance, offering insights into financial performance and client payment progress.
Manage Columns:
Filter & search :
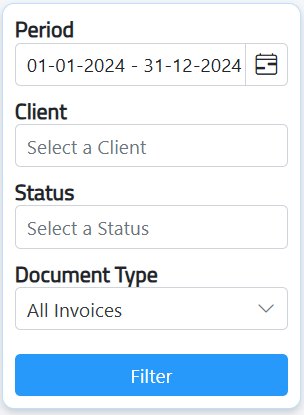
- Search by : Date range
- Client: Seach by specific client
- Status: Filter by invoices status, posted, paid, partially paid, reversed and more.
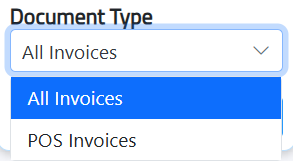
- Document Type: Show All invoices or POS invoices.
Click filter and export the inventory report in 2 formats.

