Reports
Inventory Report
Provides an overview of the current stock levels, including quantities available, items sold, cost and suppliers. It helps businesses track inventory, manage stock efficiently, and avoid shortages or overstocking.
Manage Columns:
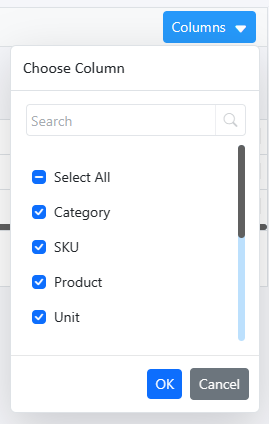
Select the columns to be visible
Filter & search :

1. Search by: Specify the criteria for searching within the report, such as keywords or identifiers.
2. Tag: Select tags to filter data based on specific labels or classifications.
3. Parent Category: Choose the main category under which the data falls.
4. Sub-Category: select from the drop-down list the sub-category within the chosen parent category.
5. Location: Filter the report based on specific locations
6. Supplier: Select the supplier to filter data related to specific vendors.
7. Period: Set the date range for the report to include data within that time
8. Qty: Apply quantity filters to focus on specific amounts or ranges of items.

Click filter and export the report in 2 formats.

print pdf or export excel.
Product Earning Report
Summarizes revenue from each product over a specific period, highlighting sales performance and profitability. It helps identify top products and sales trends for better decision-making.
Manage Columns:
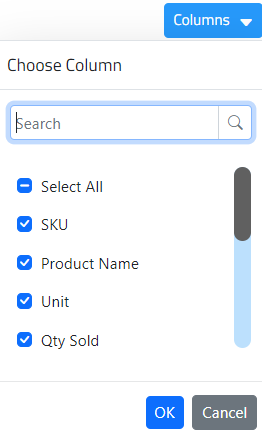
Select the columns to be visible
Filter & search :
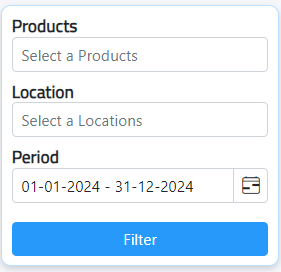
1. Search by: Specify the criteria for searching within the report, such as keywords or identifiers.
2. Location: Filter the report based on specific locations
3. Period: Set the date range for the report to include data within that time
Determination Of Product Aging
This report shows the duration for which products have been in stock, categorized into periods like 30 days, 60 days, 90 days, and beyond. This helps businesses identify slow-moving inventory, manage stock rotation, and make decisions on discounts or promotions.
Manage Columns:
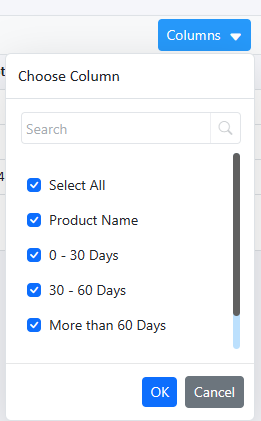
Select the columns to be visible
Filter & search :
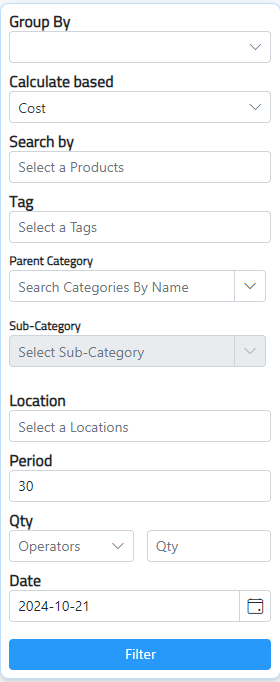
- Group By:
- Products
- Locations
- Products & Locations
- Calculate based:
- Cost
- Qty
- Qty & Cost
- Search by: Filter by specific products.
- Tag: Filter by assigned tags.
- Parent Category: Filter by parent category.
- Sub-Category: Filter by sub-category.
- Location: Filter by specific stock locations.
- Period: Search by period
- Qty: Set minimum or maximum quantity.
- Date: Filter by date.

Click filter and export the report in 2 formats.

print pdf or export excel.
Report of Stagnant Products
This report identifies inventory items that have not been sold or moved for a certain period. This report helps businesses understand which products are underperforming.
Manage Columns:
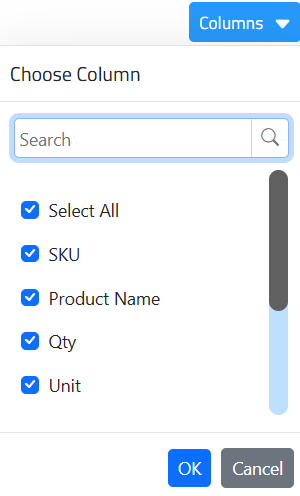
Select the columns to be visible
Filter & search :
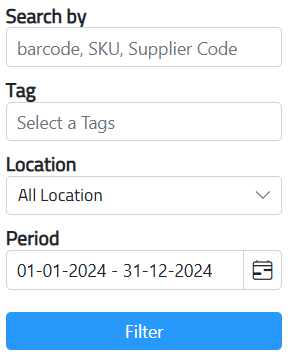
- Search by: Filter by specific products, barcode or Supplier code.
- Tag: Filter by assigned tags.
- Location: Filter by specific stock locations.
- Period: Search by date

Click filter and export the report in 2 formats.

print pdf or export excel.
Most Active Product Report
This report highlights the top-performing products based on sales volume or frequency over a specific period.
Manage Columns:
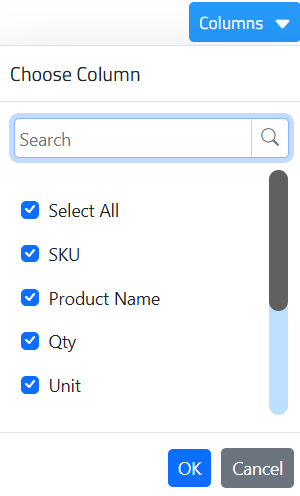
Select the columns to be visible
Filter & search :

- Search by: Filter by specific products, barcode or Supplier code.
- Tag: Filter by assigned tags.
- Location: Filter by specific stock locations.
- Period: Search by date

Click filter and export the report in 2 formats.

Movement Of Product According To Prices
This report tracks how changes in product prices affect sales and inventory movement over time. it will display comparative prices, differences between price points, and the rate at which product movement changes.
Manage Columns:
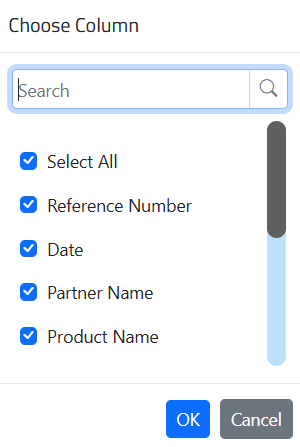
Select the columns to be visible
Filter & search :
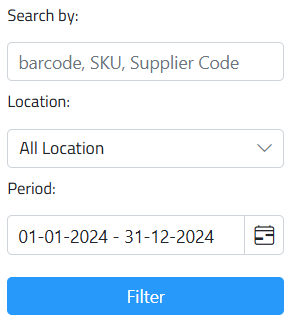
- Search by: Filter by specific products, barcode or Supplier code.
- Location: Filter by specific stock locations.
- Period: Search by date.

Click filter and export the report in Excel

Movement Of Product According To Invoices
This report will display the quantities and prices of invoices, such as purchases, sales, beginning inventory, stock entering and leaving the warehouse, and the remaining balance. This report offers a comprehensive overview of product flow, enabling businesses to track inventory levels and financial performance accurately.
Manage Columns:
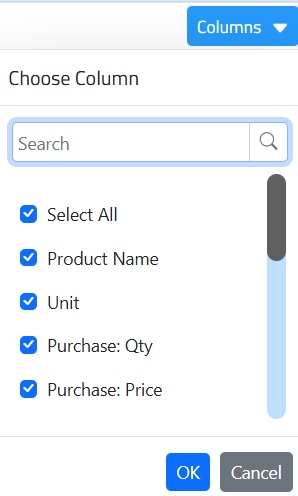
Select the columns to be visible
Filter & search :

- Search by: Filter by specific products, barcode or Supplier code.
- Location: Filter by specific stock locations.
- Period: Search by date.
Click filter and export the report in Excel

GRN PO Matching Report
This report is essential for verifying that received goods align with purchase orders. It displays the ordered quantity, received quantity, quantity difference, reference GRN, and reference PO. This report ensures accurate inventory records, supports financial accounting, and minimizes discrepancies, helping organizations maintain efficiency and reduce errors.
Manage Columns:
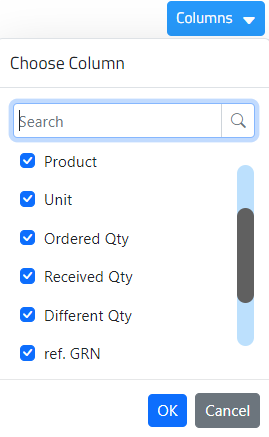
Select the columns to be visible
Filter & search :
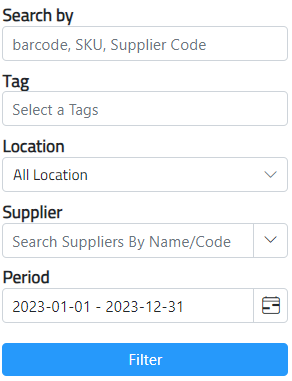
- Search by: Filter by specific products, barcode or Supplier code.
- Tag: Filter by assigned tags.
- Location: Filter by specific stock locations.
- Supplier: Select the supplier to filter data related to specific vendors.
- Period: Search by date.
Click filter and export the report in 2 formats.

print pdf or export excel.
